![Bitcoin [News Pool]](https://dohodvseti24.ru/wp-content/uploads/2021/03/onlajn-novosti-o-bitkoine-logotip.png)

The main news of the cryptocurrency market over the past week, Top growth leaders and fall, as well as an overview of changes in the cost of BTC and ETH in today's market analysis.
News about a potential Russian ban on transactions with cryptocurrencies became one of the reasons for the BTC price falling lower $40 000. Meanwhile, Twitter begins testing the use of NFTs as profile images, and Intel has taken a step into the crypto industry and plans to introduce a chip for Bitcoin mining in February.
About that, How these and other events affected the cost of crypto assets - in a weekly review.
The top of the most profitable and lost altcoins in the price: DIA—absolute leadership
● DIA/USDT: +25,49%;
● ORS/USDT: +24,33%;
● BORING/USDT: +19,88%;
● RIO/USDT: -28,95%;
● VELO/USDT: -24,36%;
● GARI/USDT: -22,54%.
The leader of the top most profitable altcoins this week led the crypto asset of the Decentralized Information Asset project (Is) with an increase of 26%. The average daily trading volume of this asset is $41.52 million.
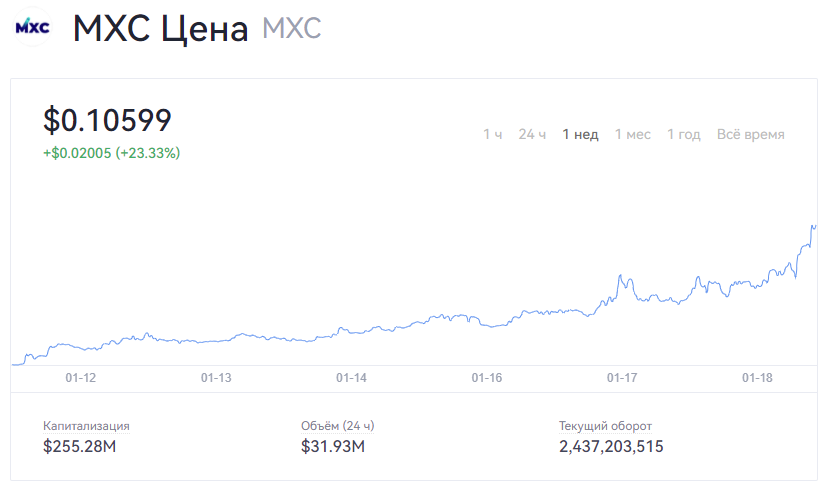
DIA is the leader of the TOP most profitable altcoins of the week.
Source: OKX
Decentralised Information Asset (Is) is a platform for open financial data in the ecosystem of financial smart contracts. DIA's goal is to unite analysts, data providers and users. DIA provides a secure bridge between off-chain data from various sources and on-chain smart contracts, which can be used to create various financial dApps.
Technical analysis of BTC: severe volatility
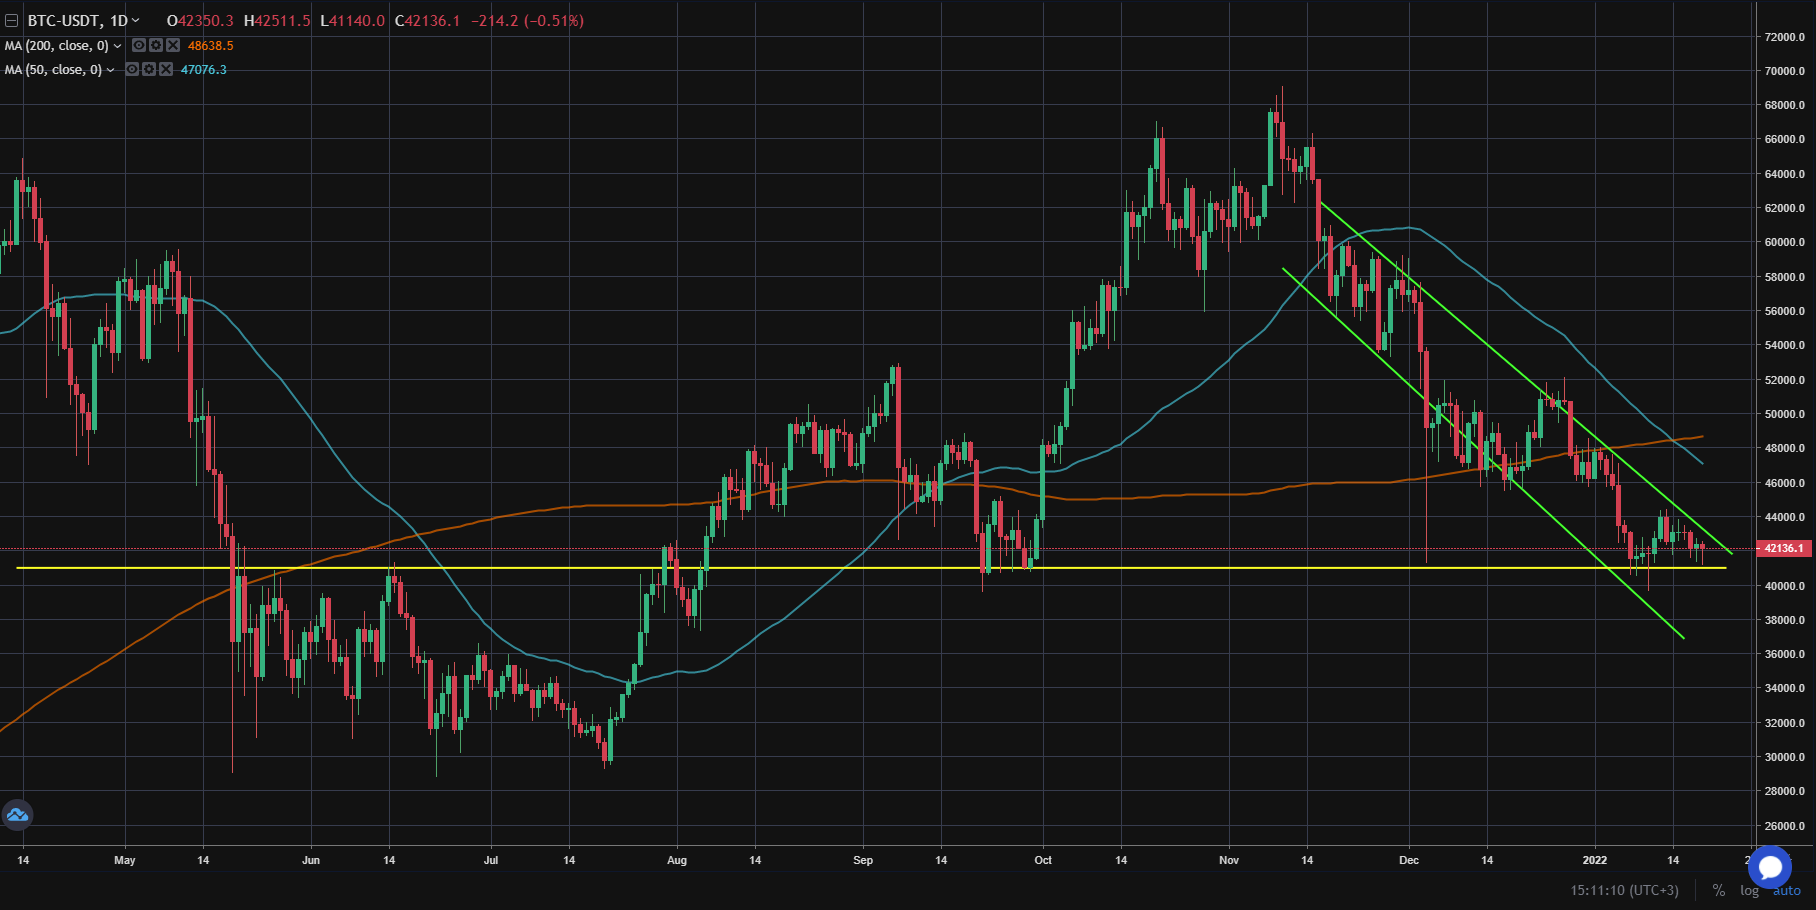
Weekly chart BTC/USDT: continuation of movement in a descending channel.
Source: OKX, Tradingview
The forecast that the cost of BTC would drop to the level came true $32 000. This event occurred due to the failure to hold an important price value $41 000. The minimum price reached at the beginning of this week was $32,843. Bitcoin is still in a downward channel, which I entered back in November last year. Currently, the price of the largest crypto asset is at the bottom line of this channel.
$32 000 — $34 000 is a very strong support zone, in which BTC was traded last summer until August 2021 of the year, just like in the beginning 2022 of the year. A rebound to the upper boundaries of the channel is likely $38 000 — $39 000. However, it is too early to talk about the end of the correction.: most likely, the price will hit this support zone, where will the accumulation of further positions come from?.
The second possible scenario is being higher $30 000. Fall option is unlikely, but, if the stock market continues to decline, then BTC can test the level $29 000. At the moment the stock market continues to fall, This is especially true for the technology sector. for instance, Coinbase share price falls for third month in a row, Rowing to 50% from historical high, what, probably, related to BTC price movement.
Technical analysis ETH: sharp movements in asset value
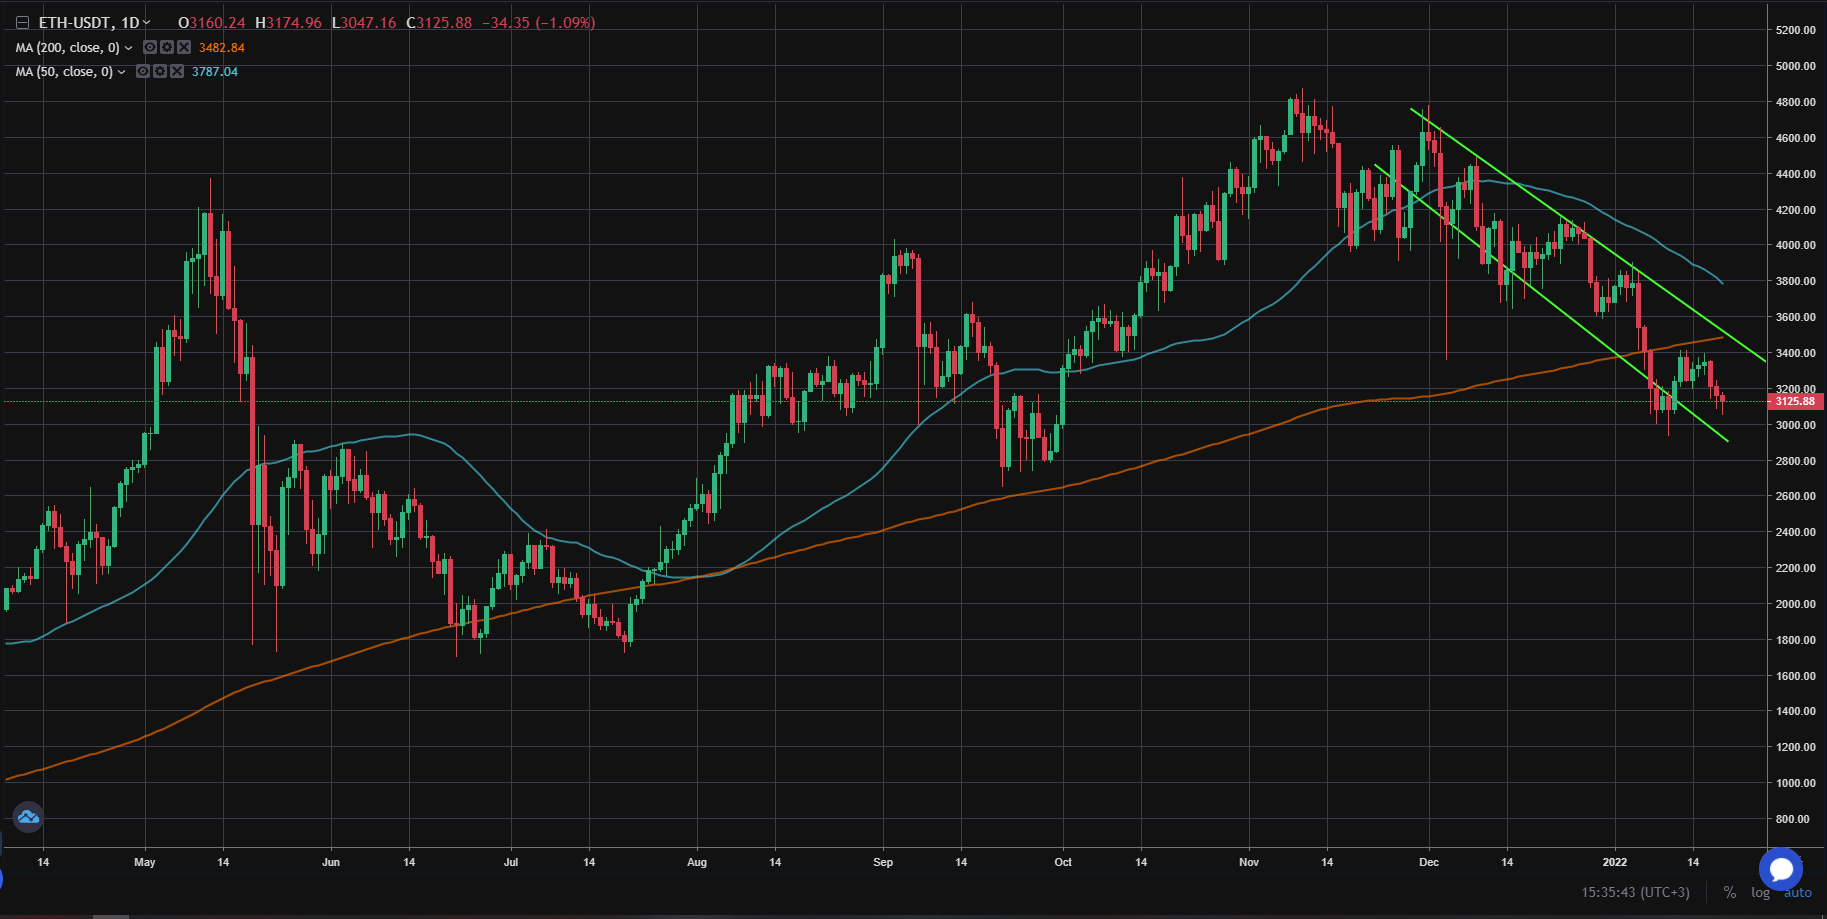
Daily graph ETH/USDT: high market volatility.
Source: OKX, Tradingview
The death cross is expected to cross soon on the ETH daily chart. The strongest zone at the moment is level $1700. If BTC continues to fall in the near future, then the price of ETH is likely to decrease to $1700. However, in the event of “idleness” or an increase in the value of Bitcoin, ether may stop falling.
ETH is currently at a good support level, because he is constantly being bought off. We must not panic and, if a losing trade is opened, then you should wait for the ETH price to roll back. Cryptocurrency growth is not expected, however, a return to 10% up - on $2700 or even to the level $3000.
It is necessary to monitor events in the BTC market and adhere to your own principles of trading strategy when trading.
Material prepared by a cryptocurrency ecosystem analyst OKX